Interactive Data Visualizations

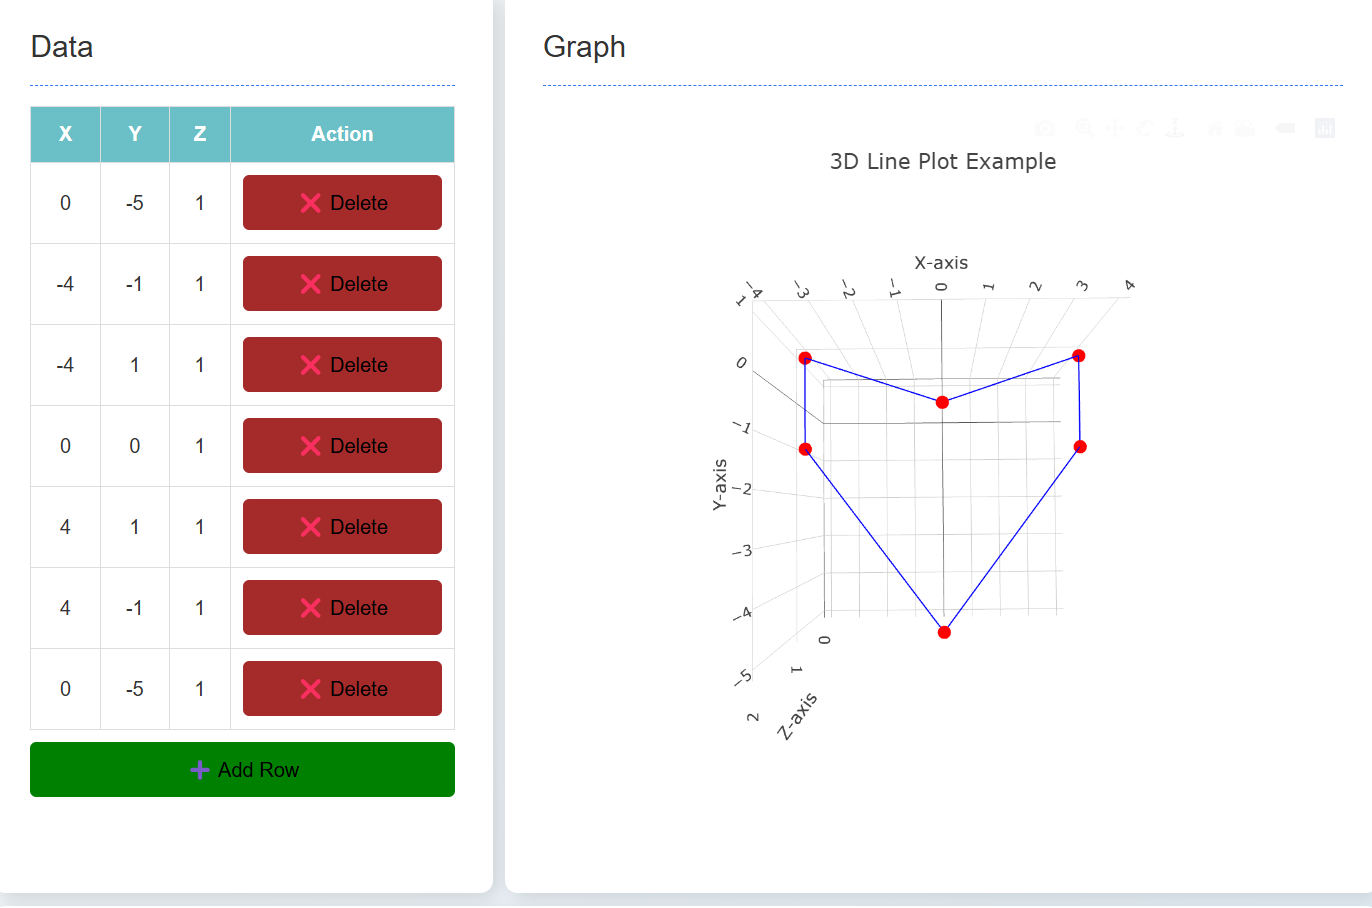
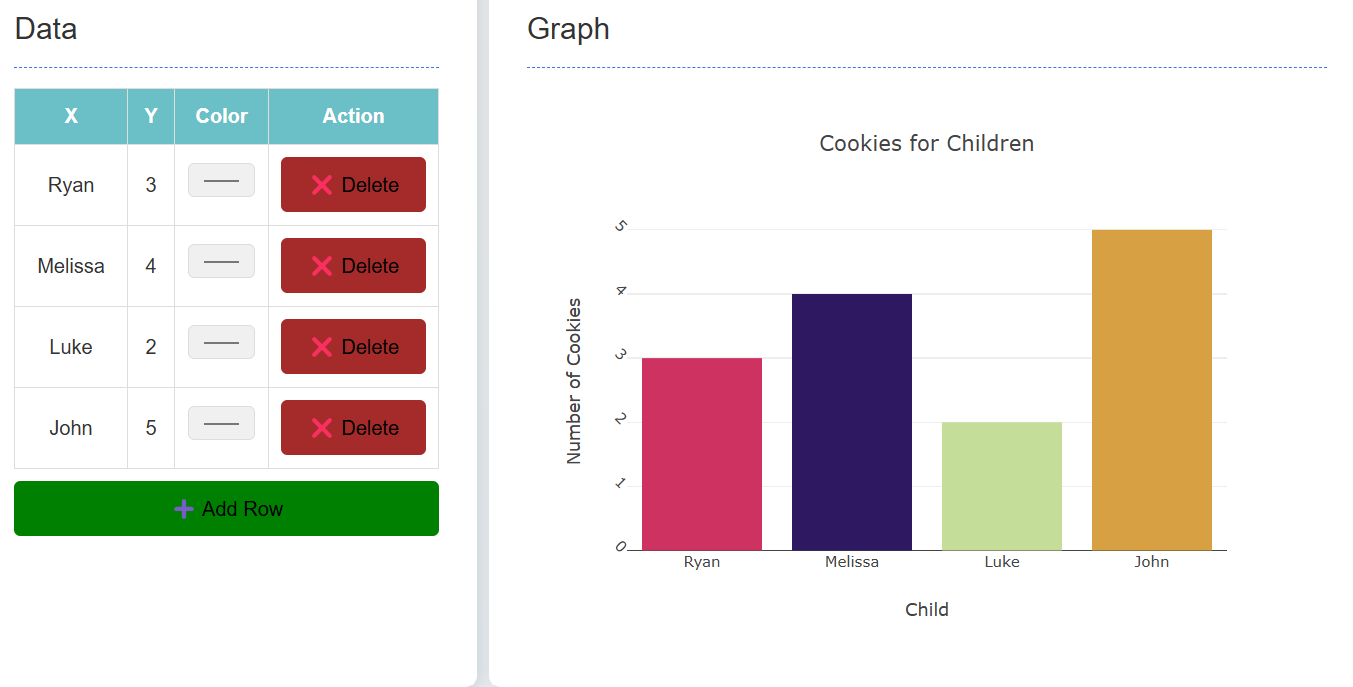
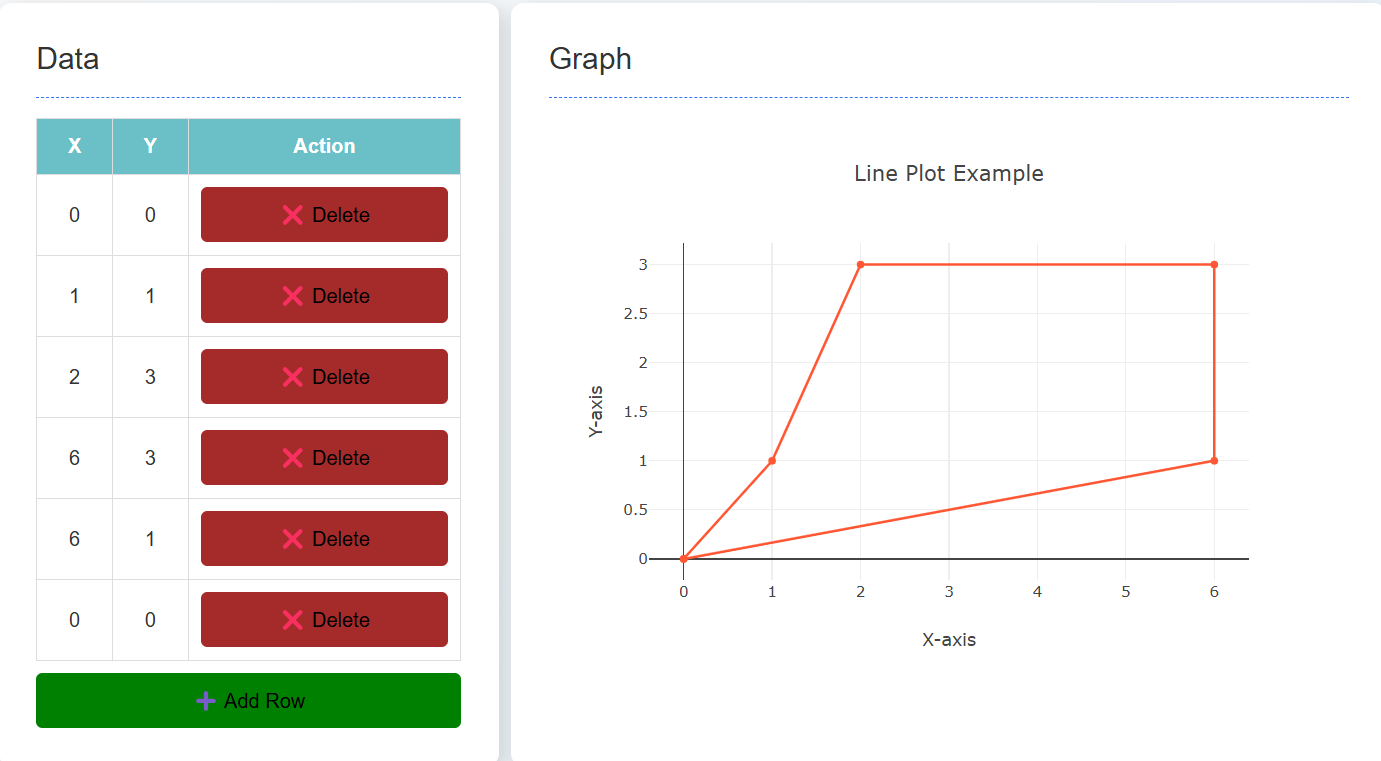
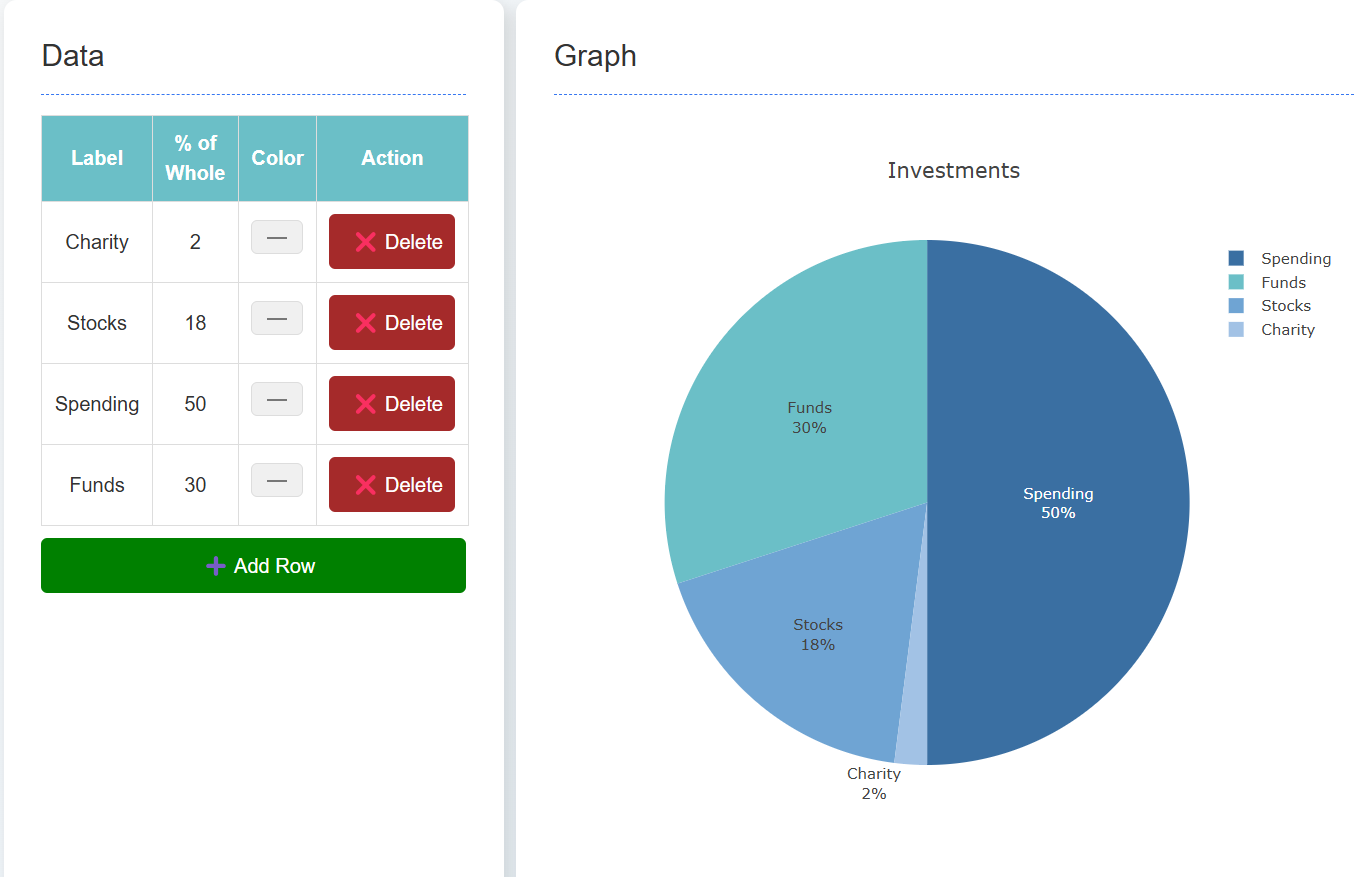
Explore, customize, and analyze data with our collection of interactive charts.

MathPlots Powered by Plotly & D3.js

3D Line Plot

Visualize data in three dimensions with interactive controls.

3D Interactive
View 3D Line Plot

Bar Graph

Compare data points with customizable bars.

Comparison D3.js
View Bar Graph

Line Plot

Track trends and patterns over time.

Trends Plotly
View Line Plot

Pie Chart

Visualize proportions and percentages.

Proportions Interactive
View Pie Chart

Scatter Plot

Analyze relationships between variables.

Correlation Plotly
View Scatter Plot

Stair Plot

Visualize discrete changes in data.

Discrete D3.js
View Stair Plot

Key Features

Interactive

Adjust parameters in real-time.

Export

Download as PNG, SVG, or PDF.

Share

Share visualizations easily.